The Circadian Protocol - Speculative UX for Emotional Feedback in AR
In today’s world, we’re always connected but rarely balanced. The Circadian Protocol is a speculative AR concept designed to reflect emotional states through ambient cues, rather than alerts. Instead of demanding attention, it listens quietly to biometric signals and responds with visual metaphors, encouraging self-awareness and presence.
Status
Concept
Client
-
Service
Speculative Futures
Role
Product Designer
Tool
Ai · PS · AI · Adobe After Effects · AR Prototyping · Qualitative Research

Can technology listen to how we feel, not just what we do?
We live in systems that constantly ask us to do more, faster — but rarely ask how we’re actually doing.
Burnout has become normal. Our days are shaped by invisible rhythms: pings, prompts, pressure.
We push through fatigue because the systems we use don’t know how to listen.
The Circadian Protocol was created in response to that silence.
It imagines a world where technology senses our limits, not just our actions.
Where slowing down is not failure, but a form of awareness.
This matters because well-being is no longer just personal.
When stress becomes ambient, it affects how we think, connect, and care.
Data Sources
The Circadian Protocol listens quietly, not just to what we do, but to how we feel.
To understand the user’s internal state, it draws from a blend of passive sensing, environmental context, and self-reflection.
These inputs aren’t used to predict or optimize.
Instead, the system mirrors them back through subtle, ambient cues — helping the user notice patterns, shifts, and needs.
Over time, this becomes a living interface that knows when to speak, and when to stay quiet.
Internal Data (from biometric sensing) | Environmental data (from surroundings) | Self-reported data (from the user) |
|---|---|---|
Collected through wearable sensors or ambient tracking:
| Contextual signals from the environment:
|
|
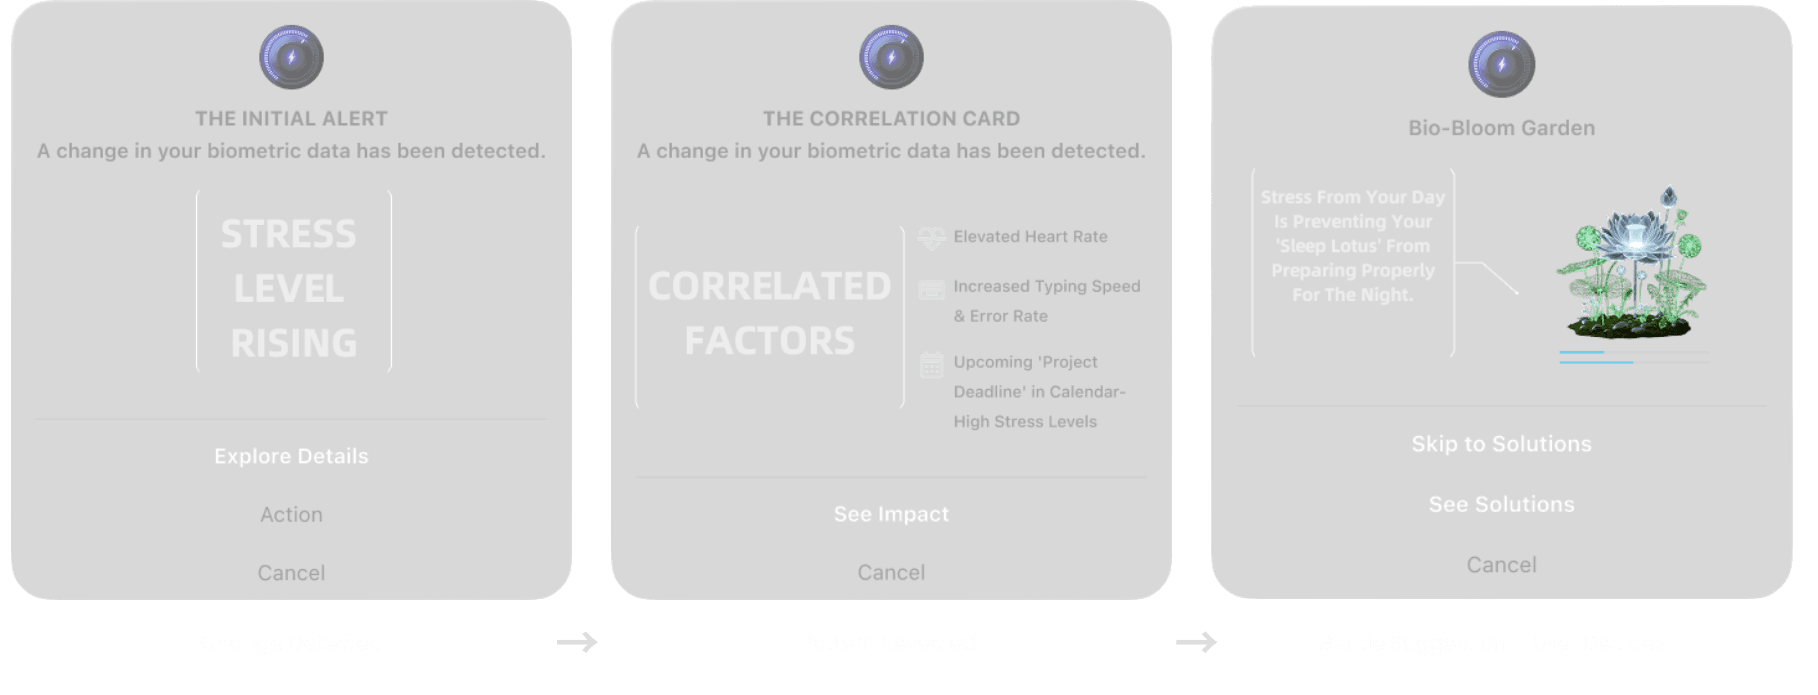
User Flow
Passive biometric + emotional data detection
AR layer adapts (colour, light, subtle visuals)
Optional soft prompts for reflection or sanctuary
Feedback loop: the system learns your rhythm over time
Interaction Samples
“Your Bio-Bloom Garden dims as your stress increases.”
“Would you like to enter a Sanctuary?”
“Notice how your typing slowed after 90 minutes?”


Concept Features
Feature | Description |
|---|---|
Bio-Bloom Garden | Digital plants that bloom, fade, or droop based on user state (focus, stress, rest) |
Selective Ignorance Shield | Filters real-world audio/visual input during tense moments (e.g., family conflict) |
Correlation Cards | Prompt user reflection on subtle patterns (e.g. sleep + stress) |
Three-Tiered Feedback | Ranges from ambient cues to immersive “Sanctuary” interventions |

How it feels in action
Scenario 1: The Sanctuary
It’s 6 AM. Sarah is alone in the office, focused on a deadline. The room is calm but inside, stress is quietly building. The system senses it: rising heart rate, shallow breath, error-prone typing. At first, it responds softly a shift in colour, a subtle focus soundscape. Nothing intrusive. Then comes the tipping point: she sighs. The system offers,
“Would you like to enter a Sanctuary?” She says yes.
The office transforms into a forest. No alerts. No pressure. Just rest. After 10 minutes, she returns. Nothing lost. Clarity gained.
Biometric feedback becomes ambient AR experiences.
ADK (Alternative Distribution Channel) dashboard acts as a bridge between servers and clients; collecting, reporting, and analyzing all user requests. Accessible via mobile, web, and desktop platforms, it also monitors the status of other connected services, delivering real-time updates and insights. The dashboard features user activity graphs, server status indicators, and a variety of reports and visualizations to keep users informed. It’s used by financial professionals to track system health, latency, user behavior, and data distribution pipelines via web, desktop, and mobile platforms.